

The SpaceX Filing in 18 charts.
A chart-forward read of Space Exploration Technologies Corp.'s Form S-1, revenue mix, launch cadence and cost curve, Starlink unit economics, AI compute scale, CapEx burn, and backlog.


Welcome to CtR.
I’m Rubi, a chartist and event contracts trader.
This issue is on the SpaceX IPO.
All data is pulled from the official S-1 filing with the SEC.
All of my charts are free to use for any purpose on any platform. Please credit “Charting the Rubicon” and/or directly link to this post or my Substack.
Thank you!
Here is a PDF download of the pack:
The SpaceX S-1 in 18 charts
Space Exploration Technologies Corp., (SpaceX) filed its S-1 registration statement with the SEC ahead of a planned IPO as SPCX 0.00%↑. It is one of the most anticipated IPOs of the year, and will likely clock in as the largest IPO in terms of market cap and fund raising in history.
The filing organizes the company into three reportable segments — Space (SpaceX), Connectivity (Starlink), and AI (xAI, which wholly owns X) — and discloses three years of audited financials through FY 2025, plus Q1 2026 operating data. The charts below reconstruct the key figures directly from the filing.
P&L
The first charts cover SpaceX’s consolidated and segment financials for fiscal years 2023–2025.
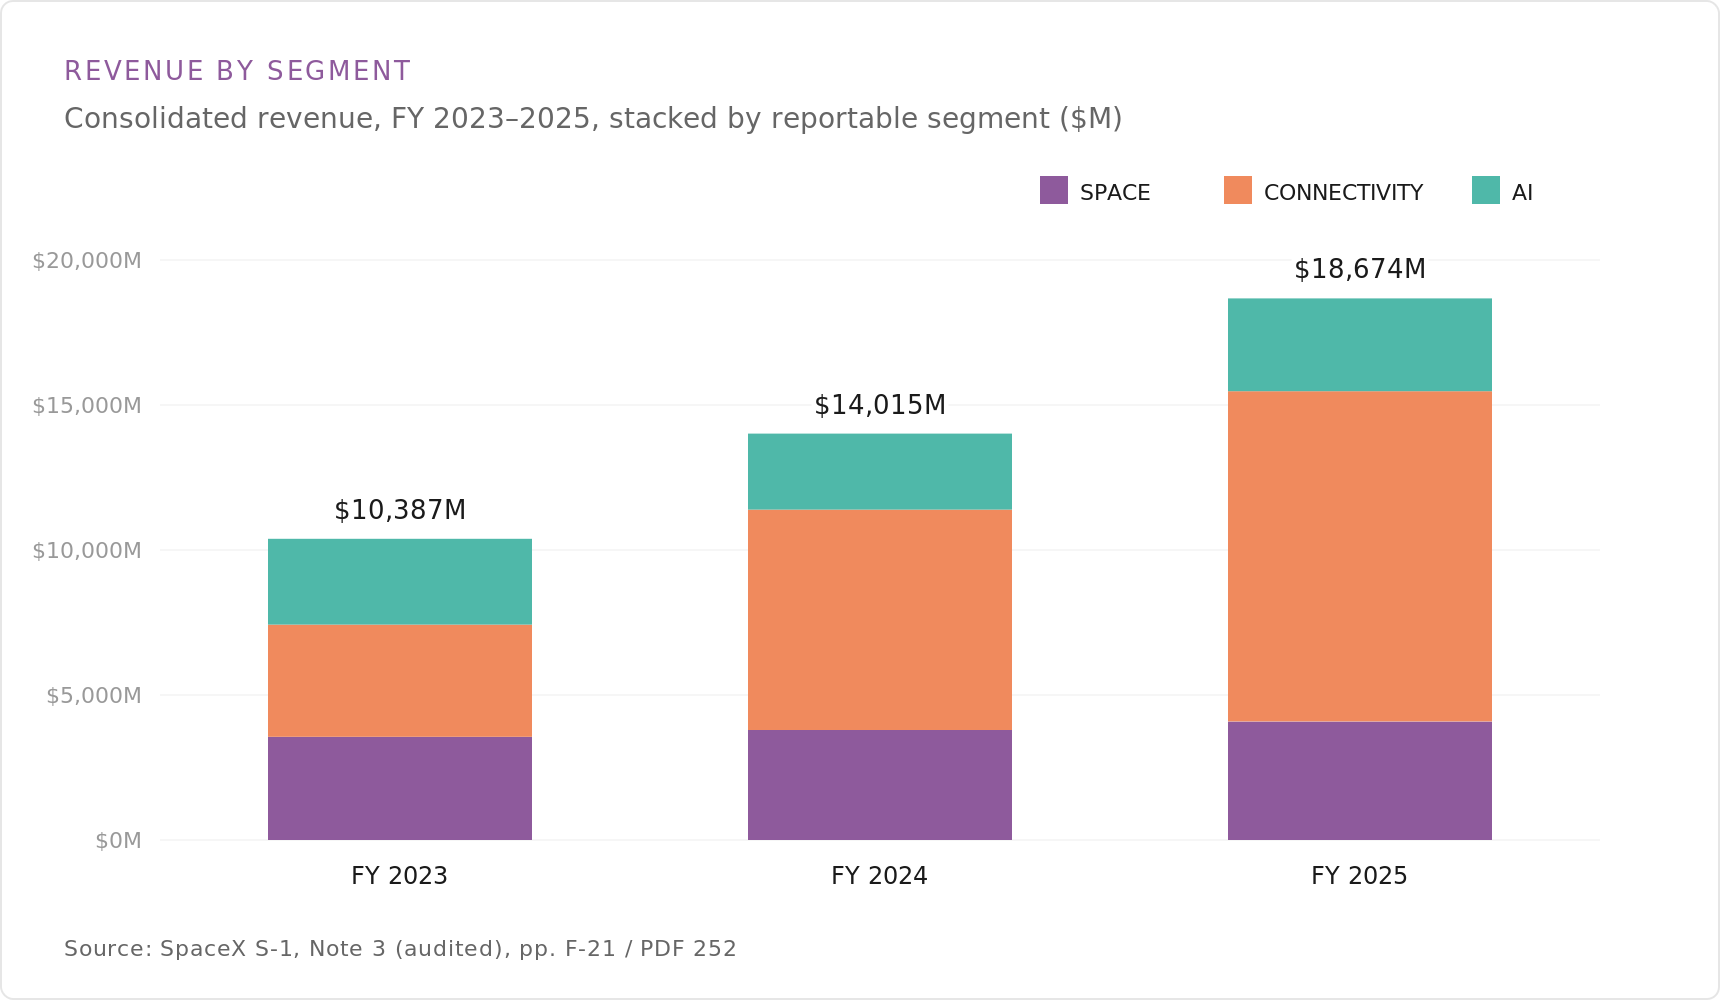
Revenue by Segment
SpaceX reported total revenue of $18.7 billion in fiscal 2025, up from $14.0 billion in 2024 and $10.4 billion in 2023. The stacked view splits consolidated revenue across the three reportable segments — Space, Connectivity, and AI — with Connectivity (Starlink) the largest and fastest-growing contributor over the period. Figures are from Note 3 of the audited financial statements.
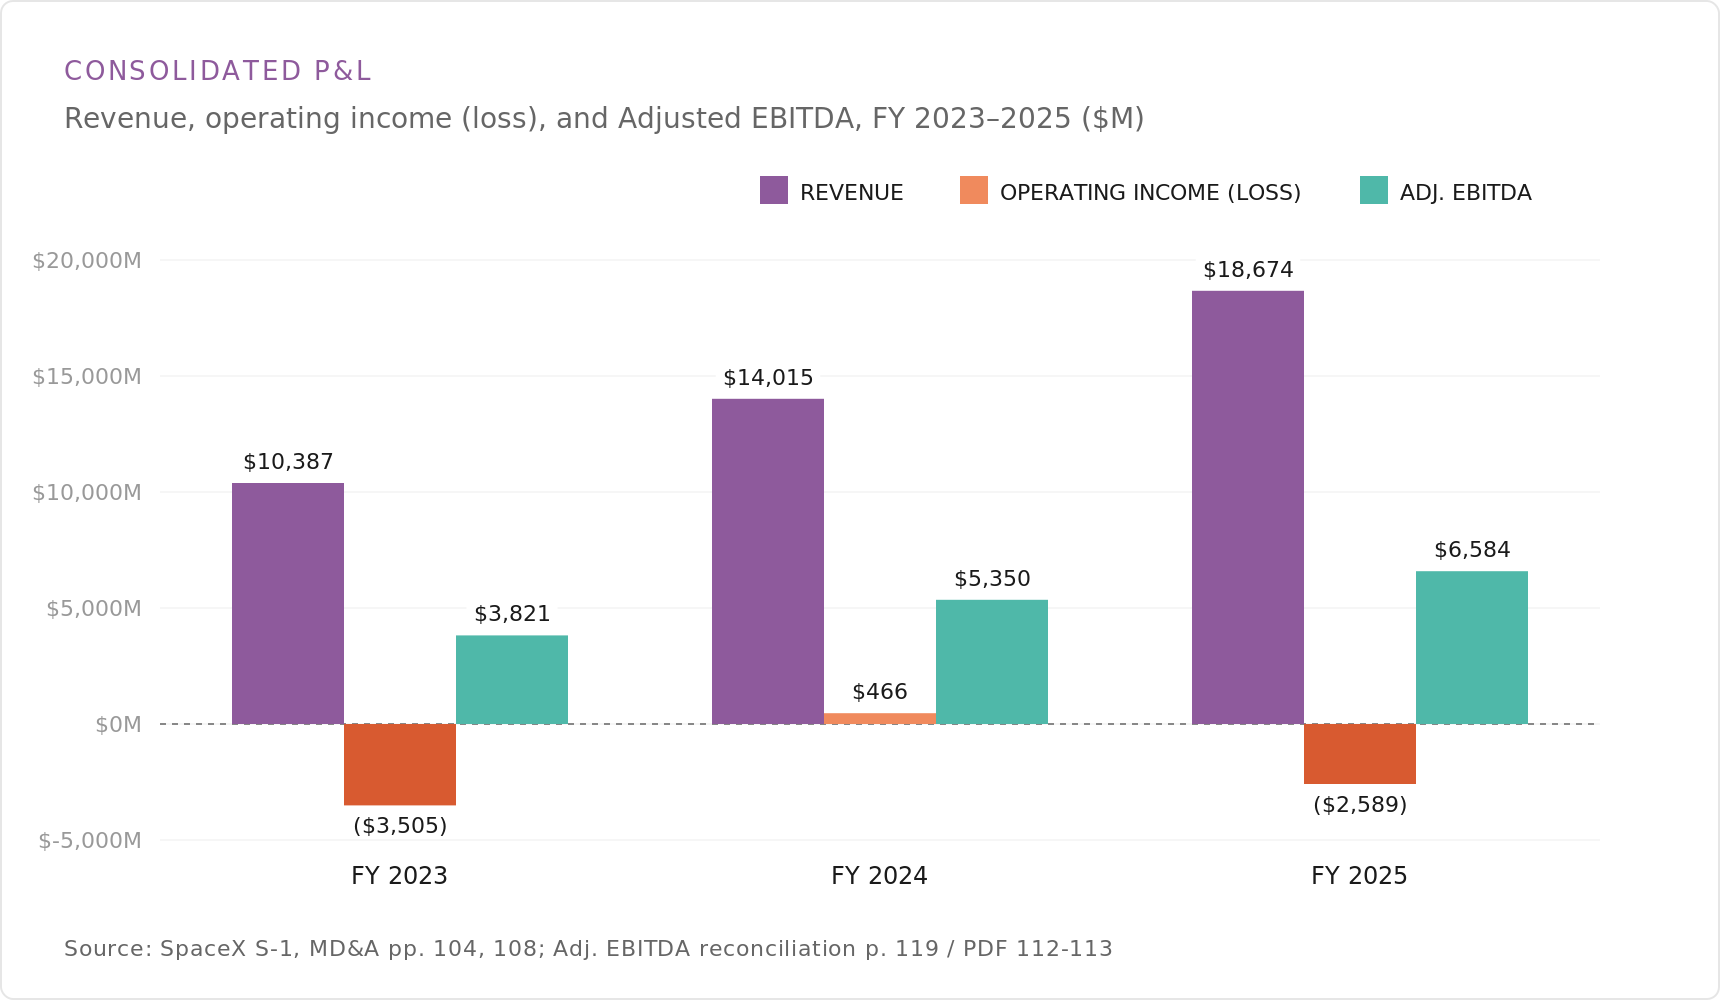
Consolidated P&L
This chart sets SpaceX’s revenue against its operating income (loss) and Adjusted EBITDA for fiscal 2023 through 2025. The company posted a $3.5 billion operating loss in 2023, swung to $466 million of operating income in 2024, then reported a $2.6 billion operating loss in 2025, while Adjusted EBITDA — a non-GAAP measure of earnings before interest, taxes, depreciation, and amortization, with certain other items added back — rose each year to $6.6 billion. The gap between positive Adjusted EBITDA and negative operating income reflects large depreciation and amortization charges.
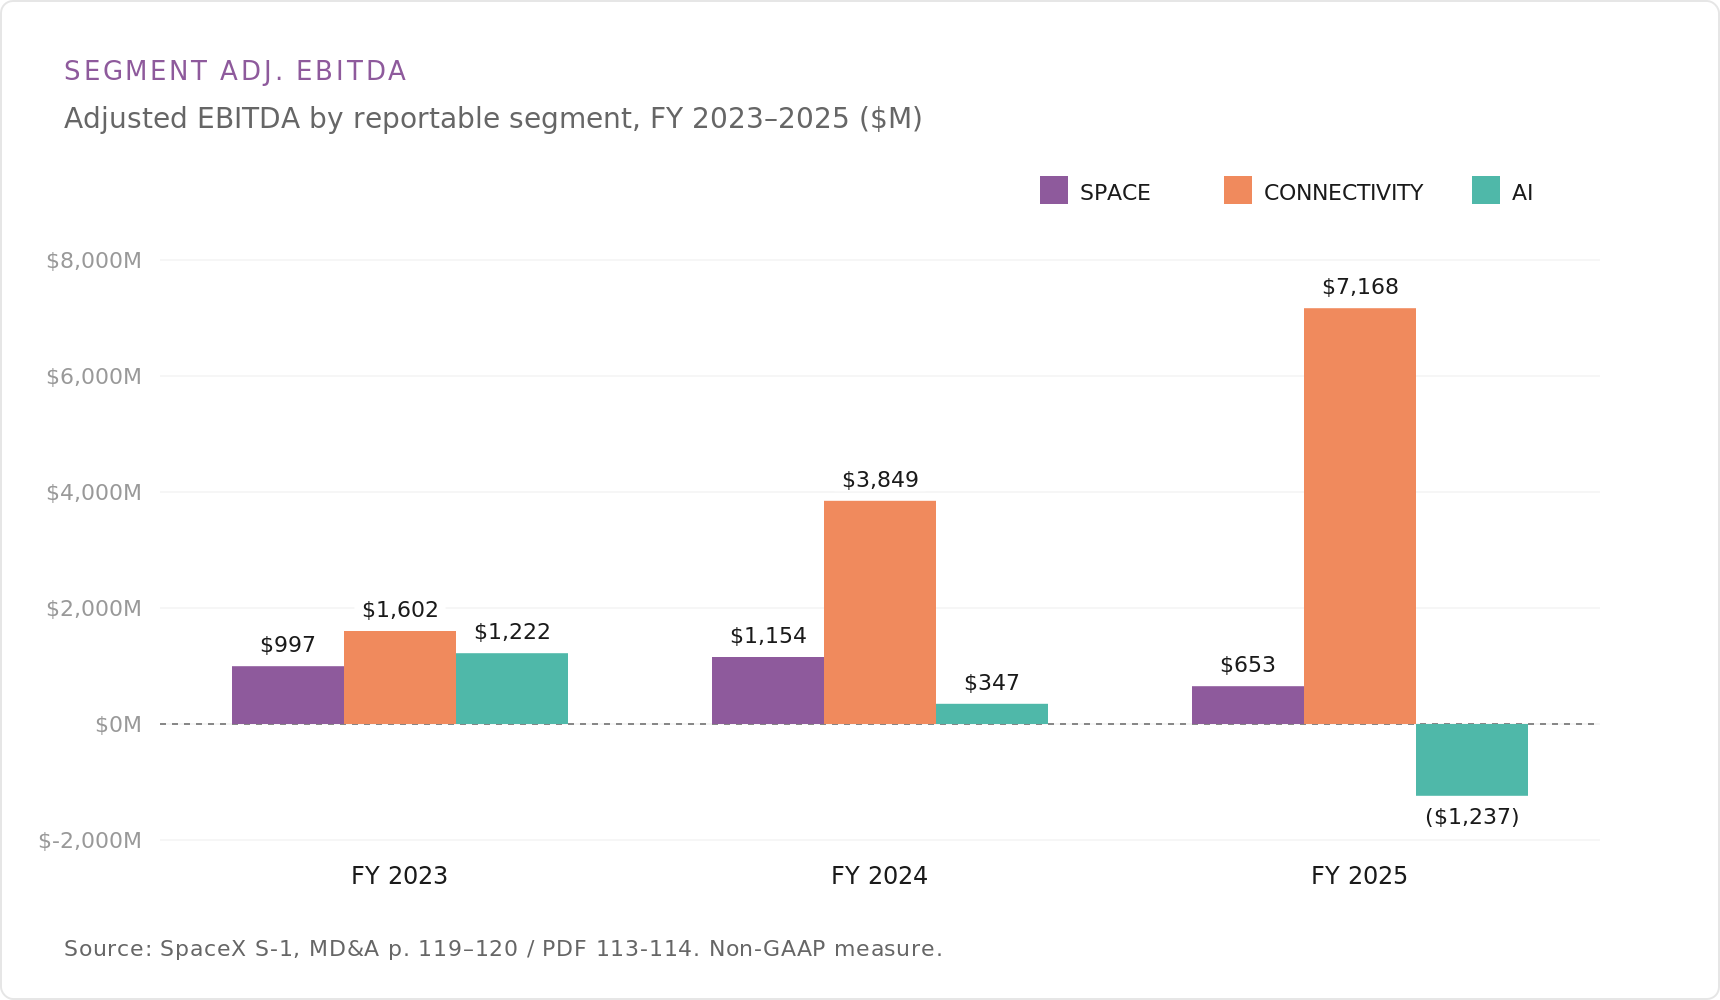
Segment Adj. EBITDA
Breaking Adjusted EBITDA down by segment shows where SpaceX generates and consumes cash. Connectivity (Starlink) Adjusted EBITDA grew from $1.6 billion in 2023 to $7.2 billion in 2025, the Space segment held in a roughly $0.7–1.2 billion range, and the AI segment turned negative in 2025 at -$1.2 billion after a positive $1.2 billion in 2023. Adjusted EBITDA is a non-GAAP profitability measure reconciled in the filing’s MD&A.
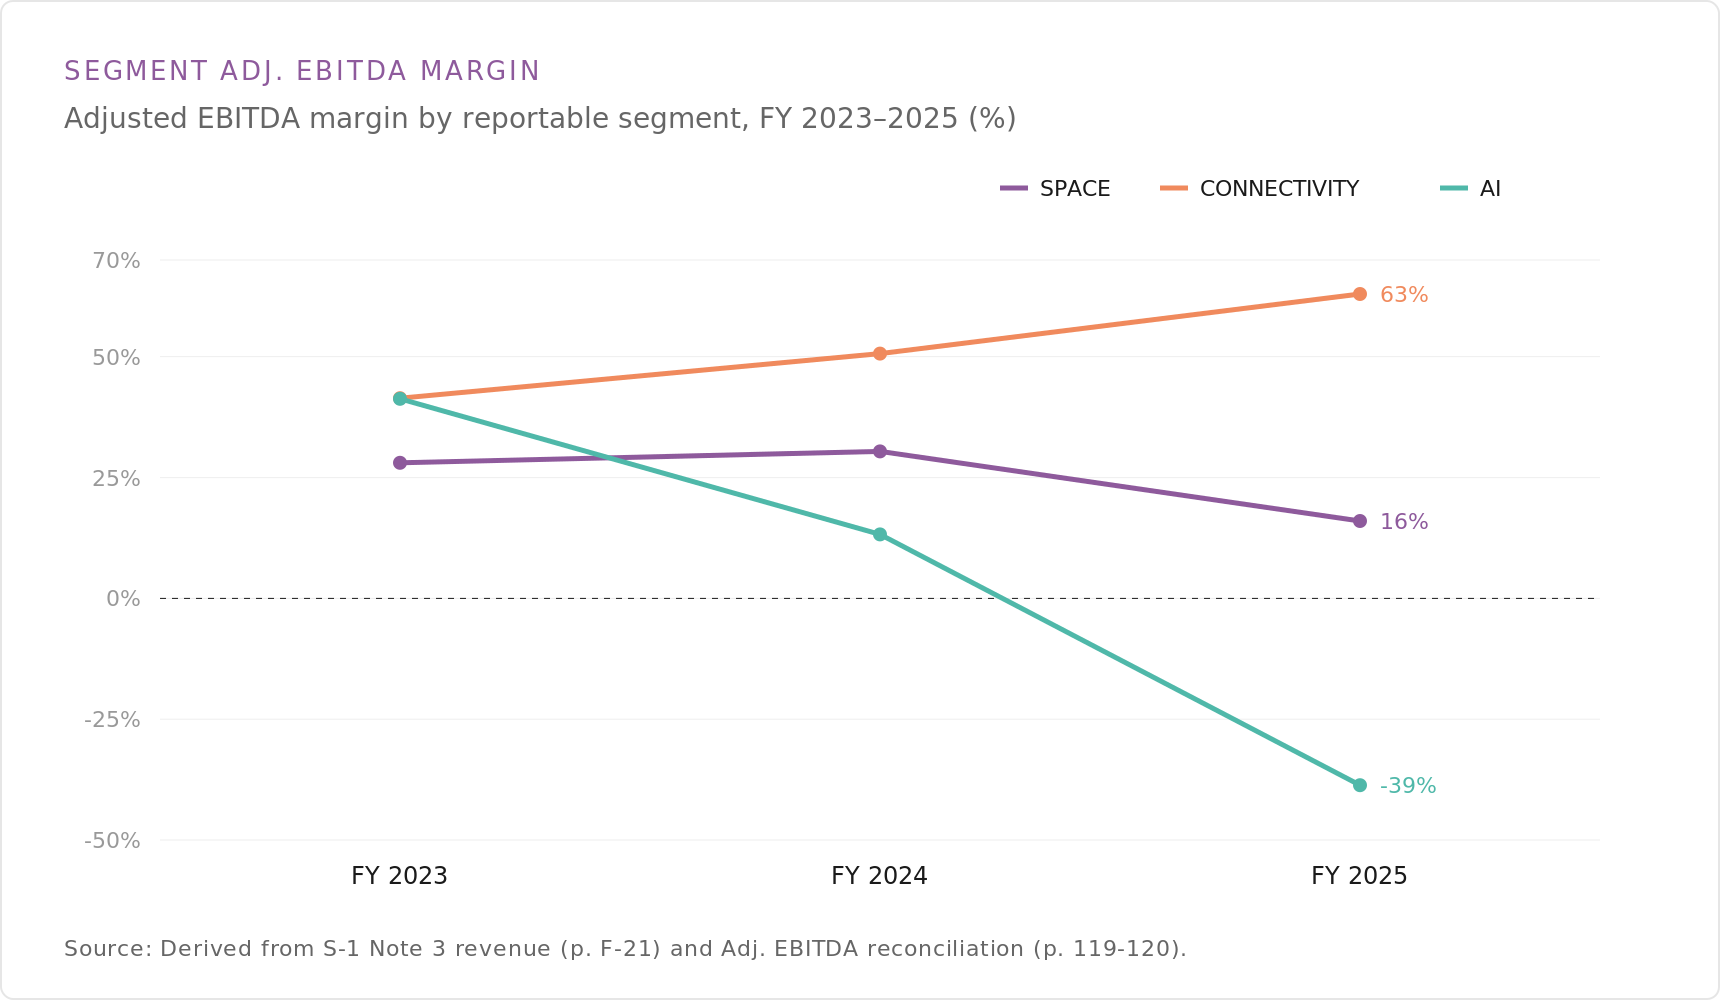
Segment Adj. EBITDA Margin
Converting segment Adjusted EBITDA into margins (Adjusted EBITDA divided by segment revenue) shows three divergent paths. Connectivity’s margin expanded from 41% to 63% over 2023–2025, the Space segment’s compressed from the high-20s to 16%, and the AI segment’s fell from 41% to -39% as spending outpaced revenue. Margins are derived from the segment revenue and Adjusted EBITDA disclosures in the S-1.
Space & Launch
The next charts cover SpaceX’s launch cadence, payload delivered to orbit, and launch economics.
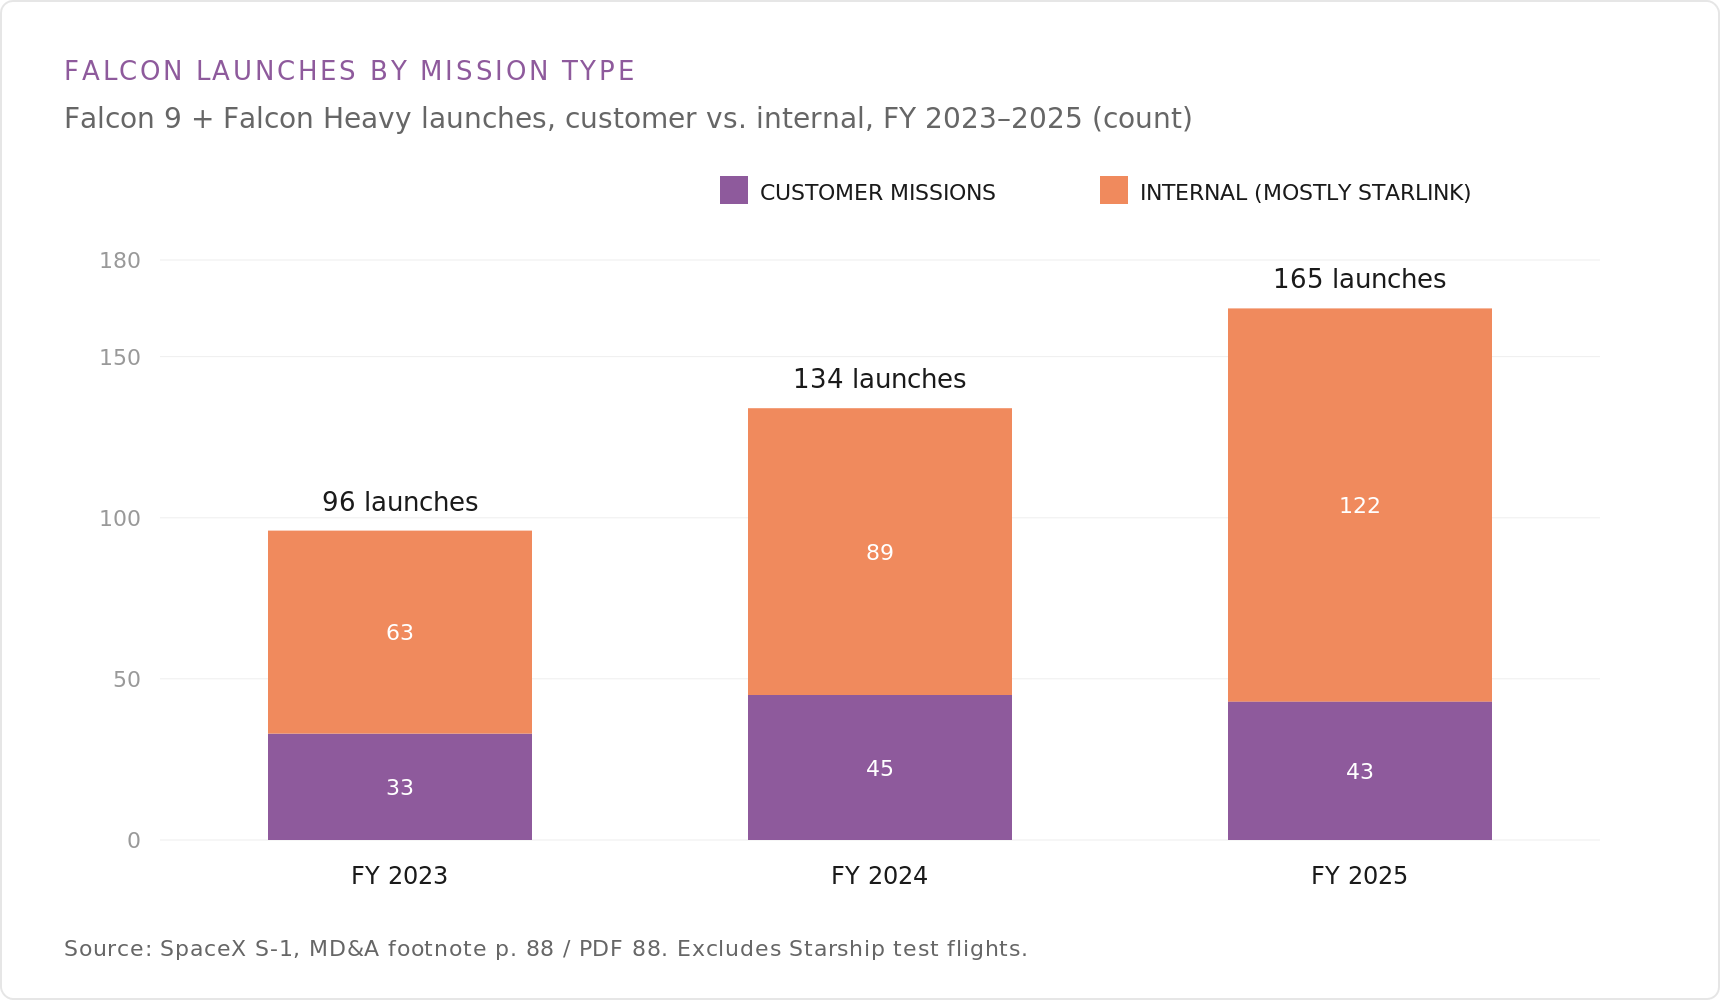
Falcon Launches by Mission
SpaceX flew 165 Falcon 9 and Falcon Heavy launches in fiscal 2025, up from 134 in 2024 and 96 in 2023, excluding Starship test flights. Internal missions — mostly Starlink satellite deployment — drove the increase, rising from 63 in 2023 to 122 in 2025, while customer missions held in the 33–45 range. Launch counts are from the S-1 MD&A.
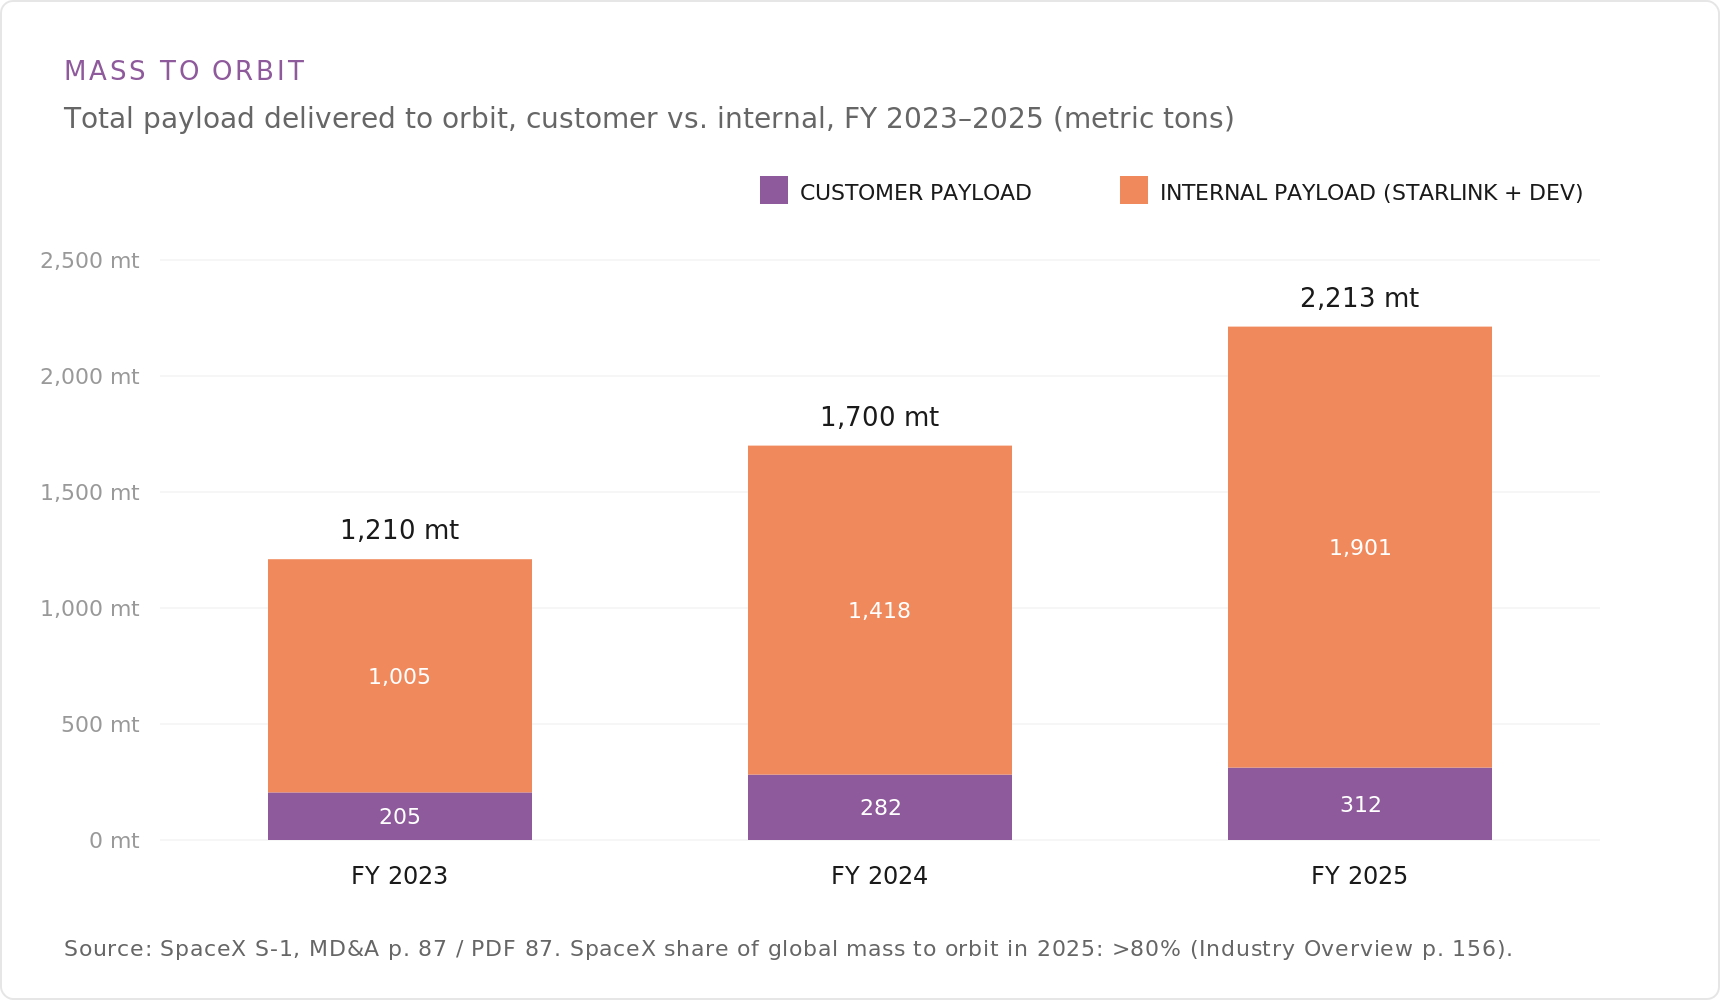
Mass to Orbit
Total payload delivered to orbit reached 2,213 metric tons in fiscal 2025, up from 1,700 in 2024 and 1,210 in 2023. Internal payload — Starlink satellites and development flights — accounts for the large majority, with customer payload growing from 205 to 312 metric tons. The S-1’s industry overview puts SpaceX’s share of global mass to orbit above 80% in 2025.
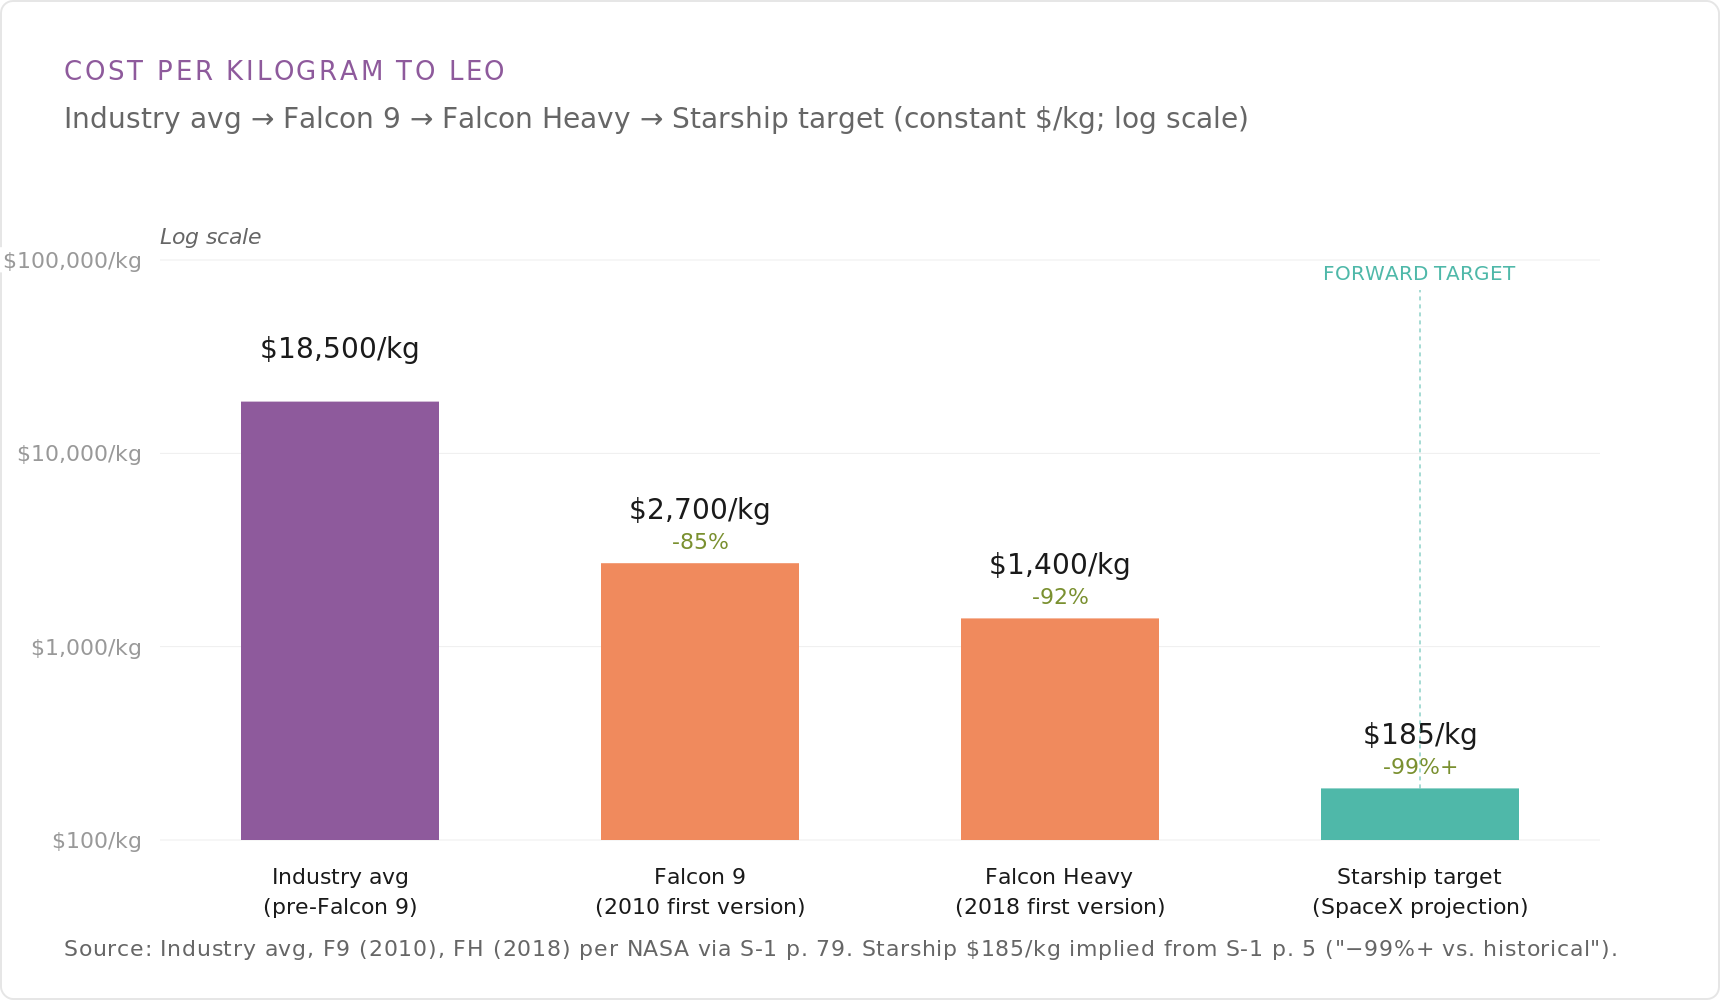
Cost per Kilogram to LEO
This chart traces the cost of reaching low Earth orbit (LEO) on a log scale, from a pre-Falcon 9 industry average near $18,500 per kilogram to $2,700/kg for Falcon 9 and $1,400/kg for Falcon Heavy. SpaceX’s forward target for Starship is roughly $185/kg, implied by the filing’s claim of a more-than-99% reduction versus historical launch costs. The industry and vehicle figures trace to NASA data cited in the S-1; the Starship figure is a SpaceX projection.
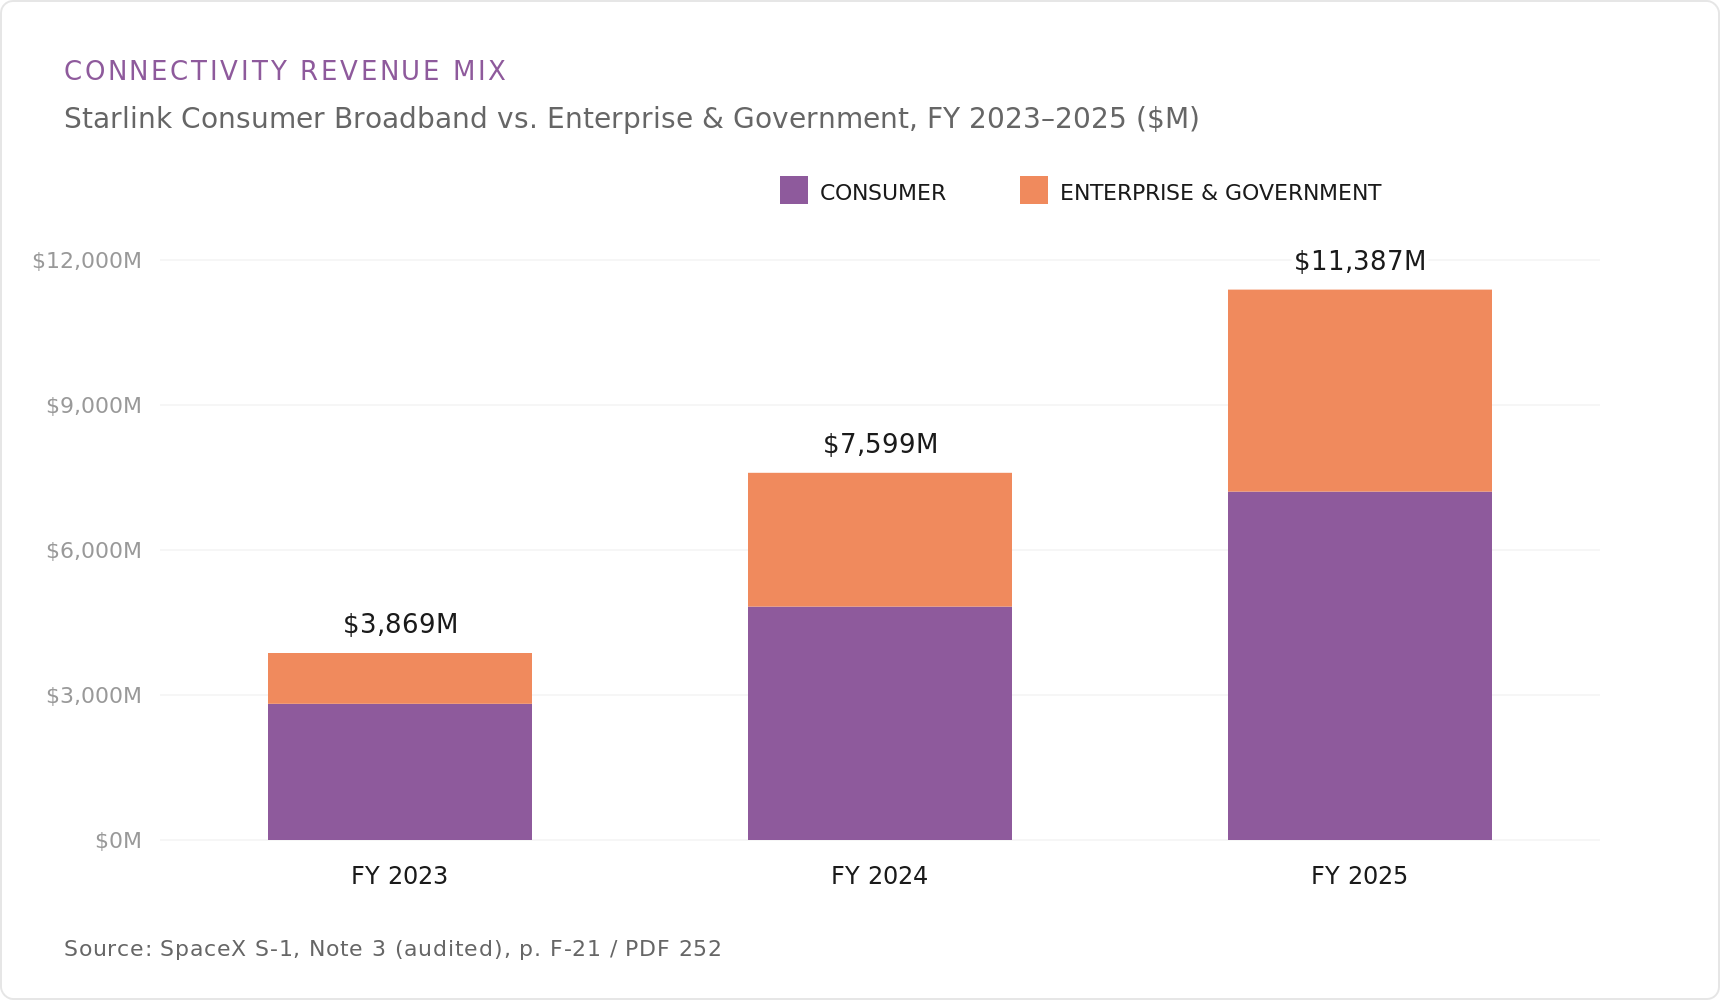
Connectivity
The next charts cover Starlink revenue, segment profitability, subscriber growth, and pricing.
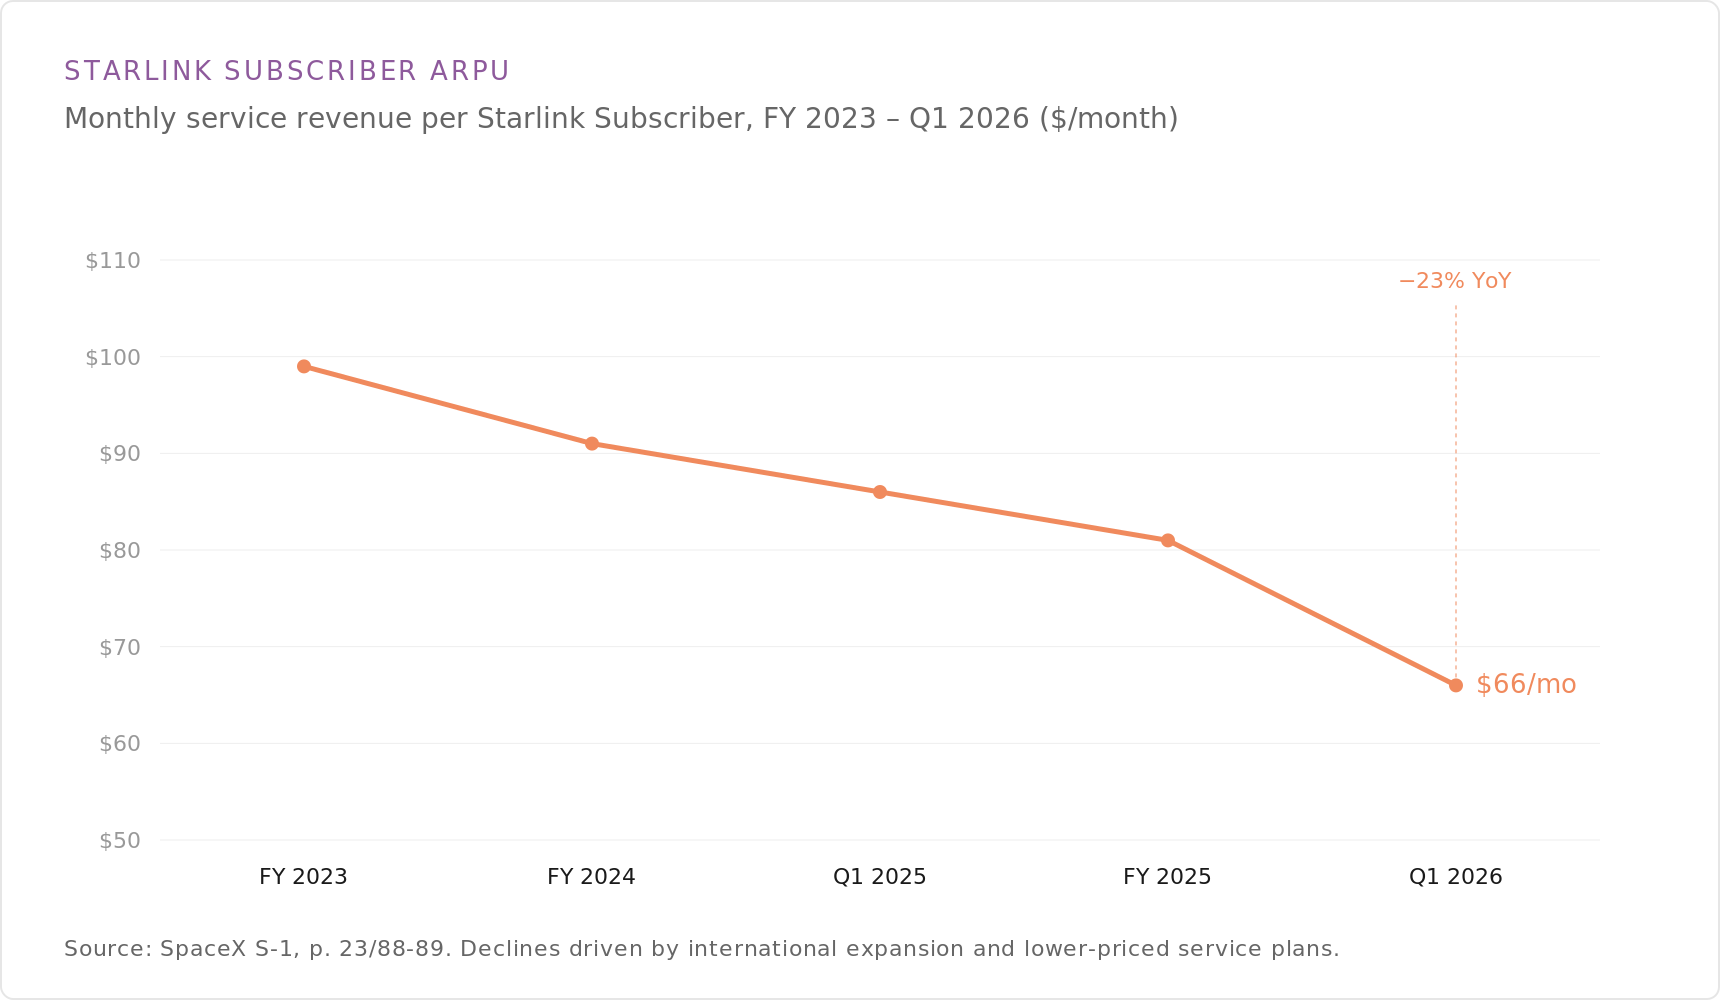
Starlink Subscriber ARPU
Starlink’s average revenue per user (ARPU) fell to $66 per month in the first quarter of 2026, down about 23% year over year and continuing a steady decline from roughly $99 a month in fiscal 2023. The filing attributes the drop to international expansion into lower-priced markets and lower-priced service plans. ARPU here is monthly service revenue per Starlink subscriber.
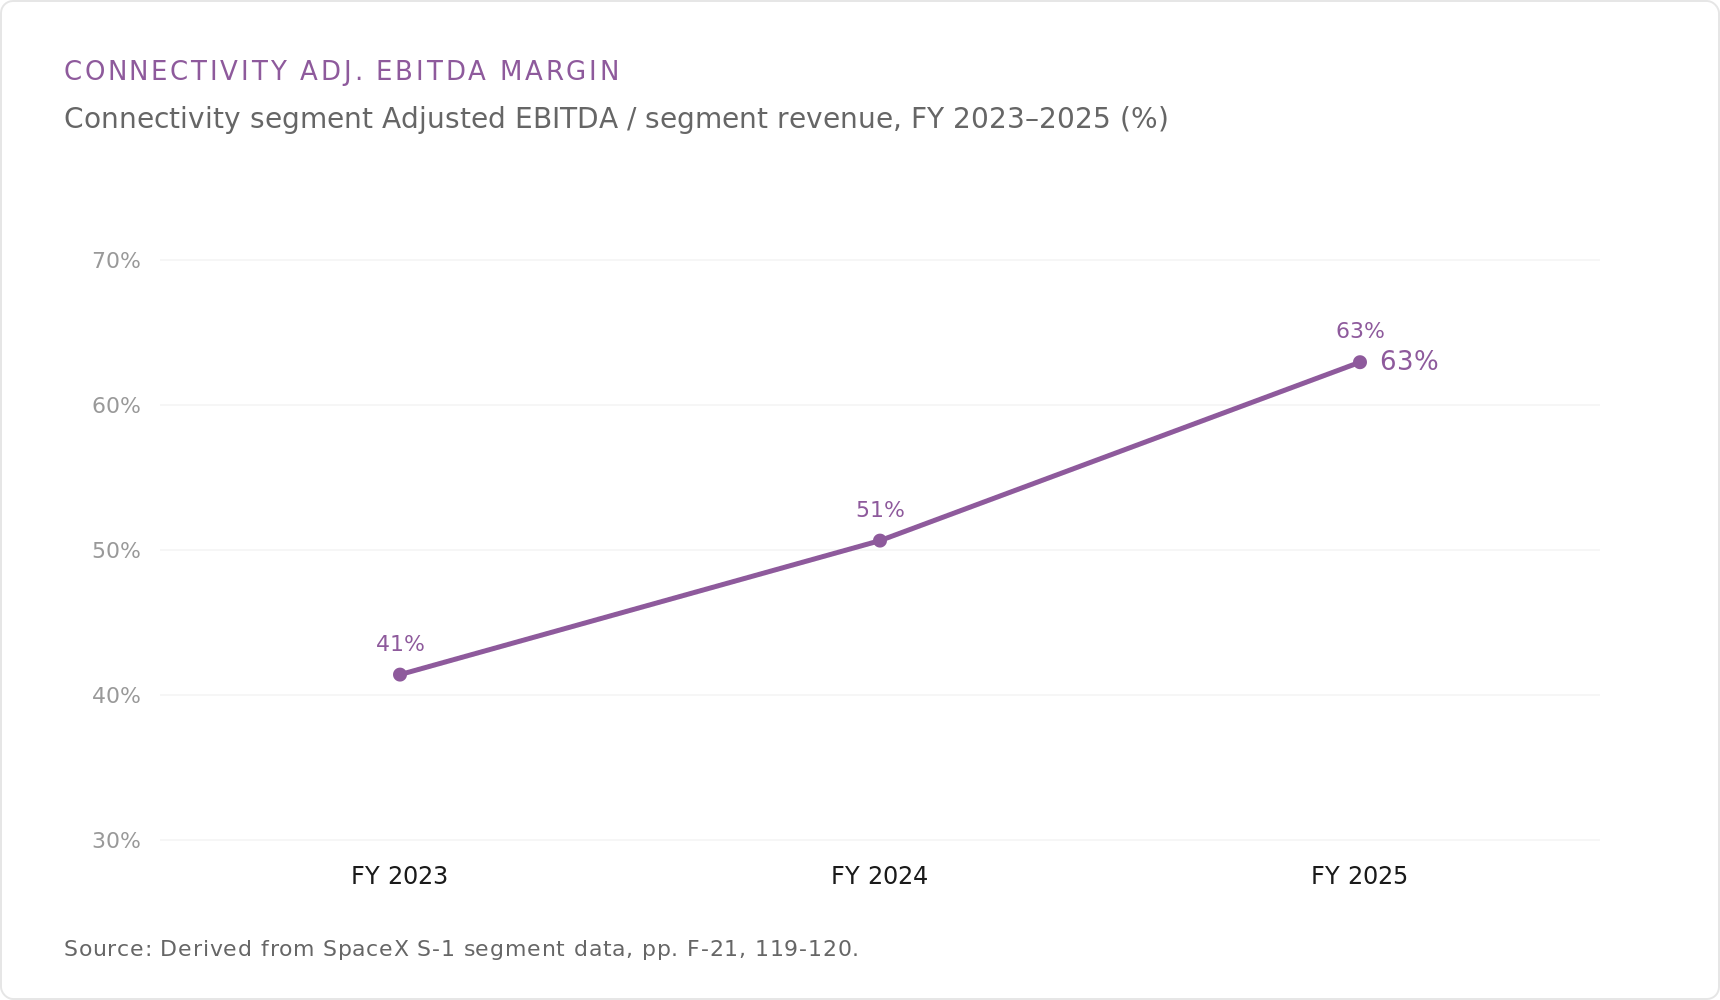
Connectivity Adj. EBITDA Margin
Starlink’s Connectivity segment Adjusted EBITDA margin expanded from 41% in fiscal 2023 to 51% in 2024 and 63% in 2025. The upward path reflects Adjusted EBITDA rising as a share of Connectivity revenue across the three years. Margin is derived from segment revenue and Adjusted EBITDA in the S-1.
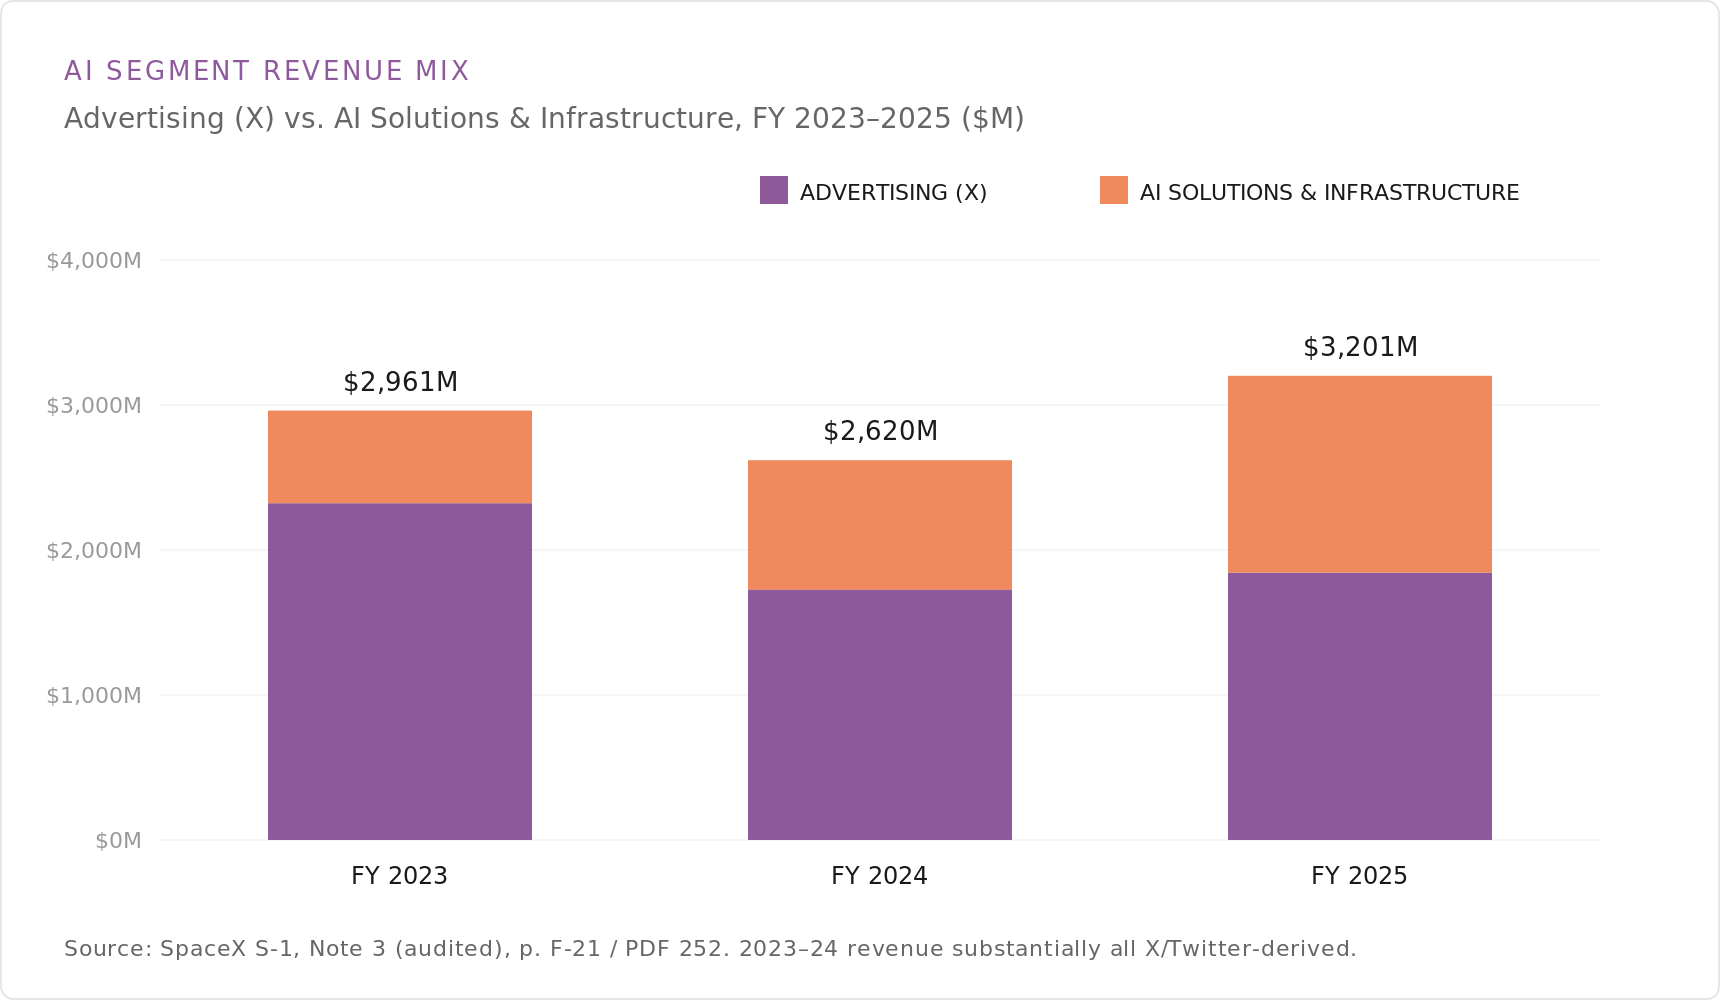
AI
The next charts cover the AI segment — X and xAI — including revenue, user funnel, compute capacity, and R&D intensity.
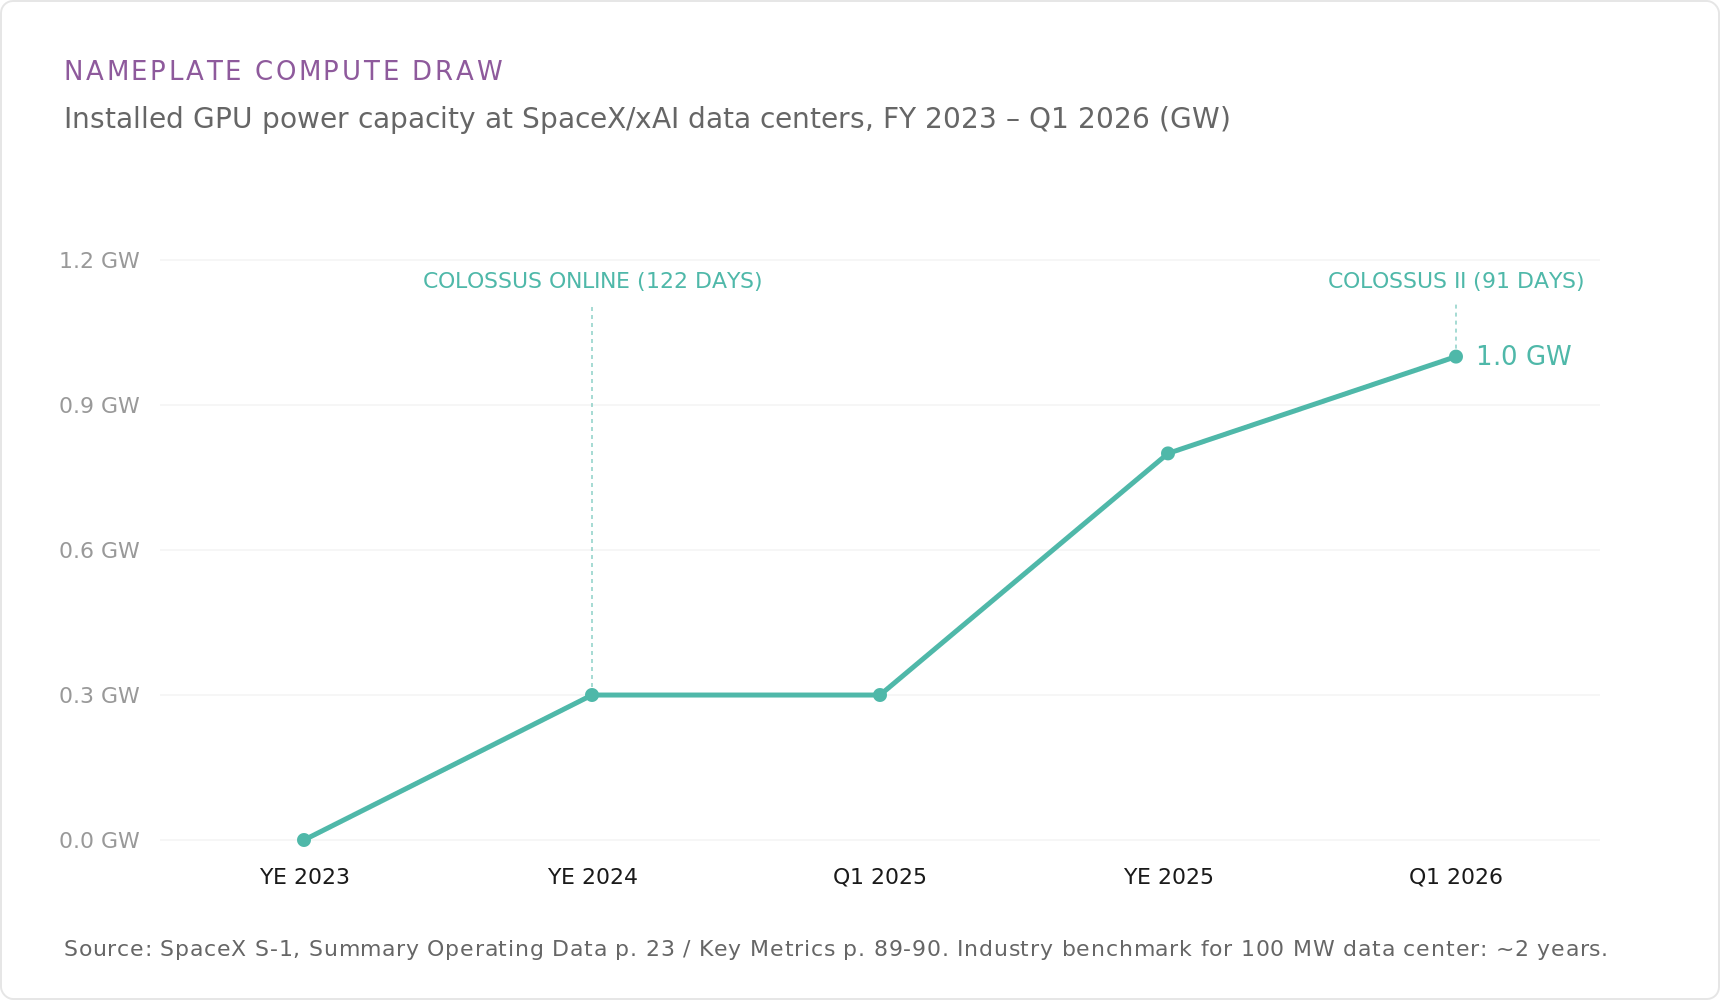
Nameplate Compute Draw
Installed GPU power capacity at SpaceX/xAI data centers reached 1.0 gigawatt by the first quarter of 2026, up from effectively zero at year-end 2023. The ramp tracks the Colossus data center coming online and the subsequent Colossus II buildout — each reaching scale in roughly 90–120 days, against an industry benchmark of about two years for a 100-megawatt facility. Capacity figures are from the S-1’s summary operating data and key metrics.
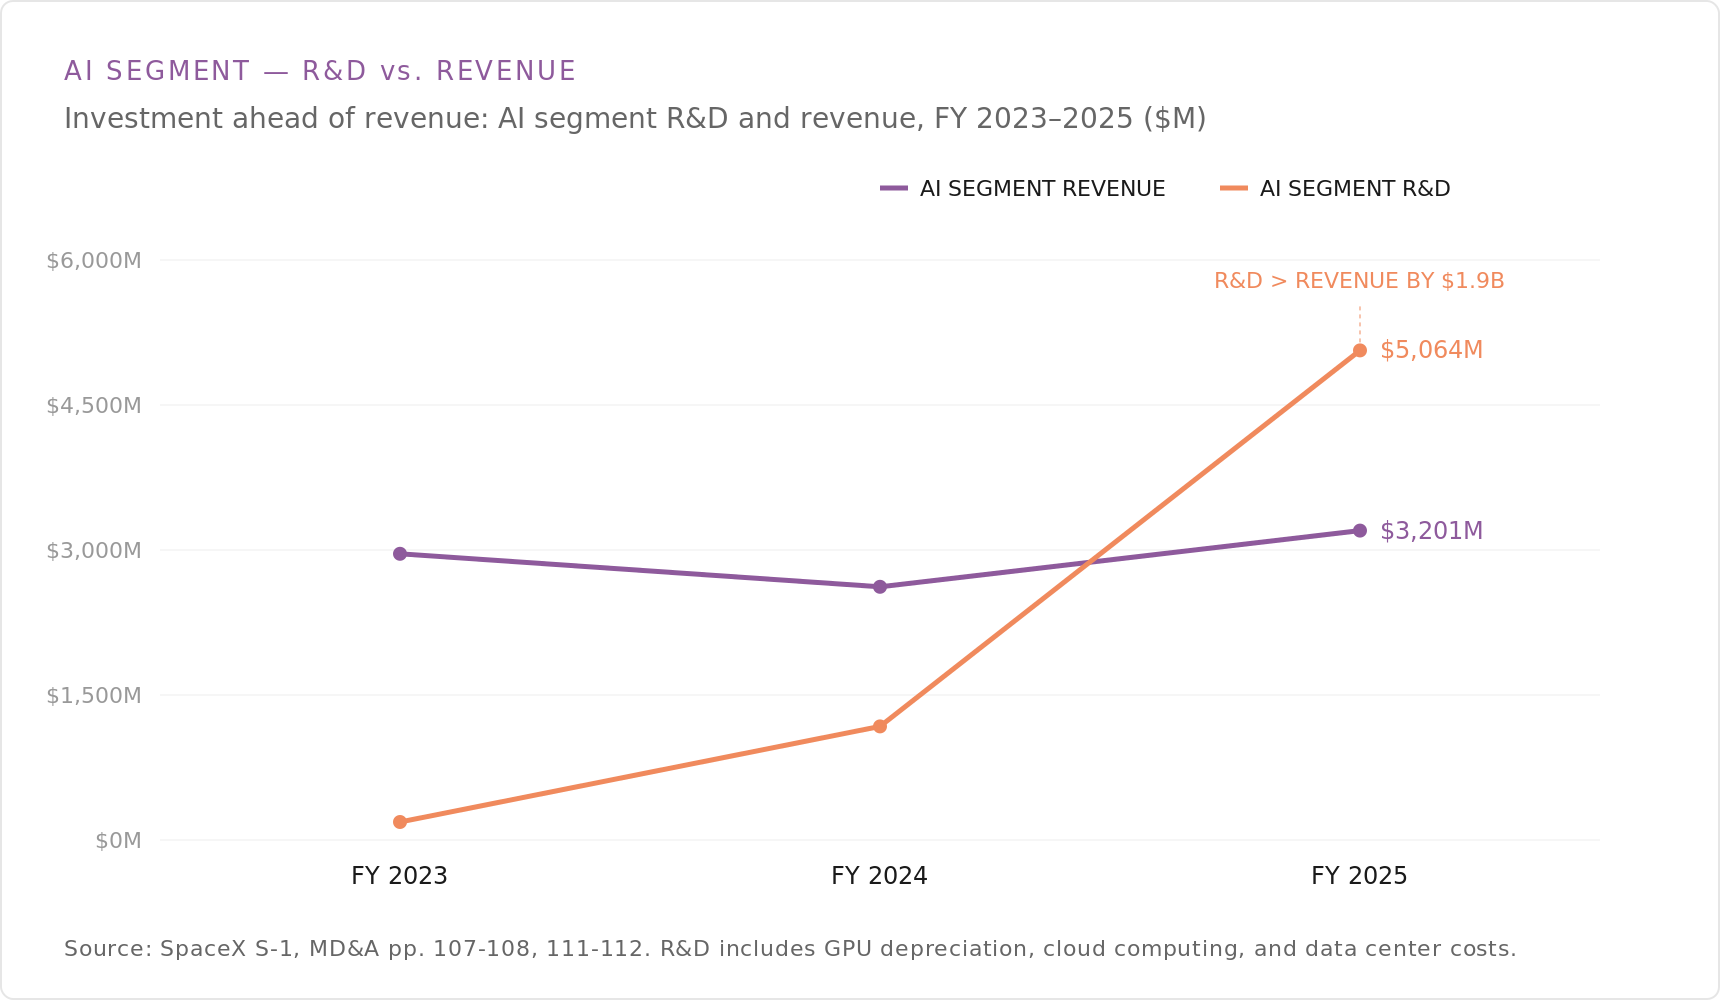
AI Segment R&D vs. Revenue
In fiscal 2025, SpaceX’s AI segment spent $5.1 billion on research and development against $3.2 billion of segment revenue — R&D exceeding revenue by roughly $1.9 billion. The chart shows R&D rising sharply over 2023–2025 while revenue stayed near $3 billion, with investment running ahead of monetization. The filing notes AI R&D includes GPU depreciation, cloud computing, and data center costs.
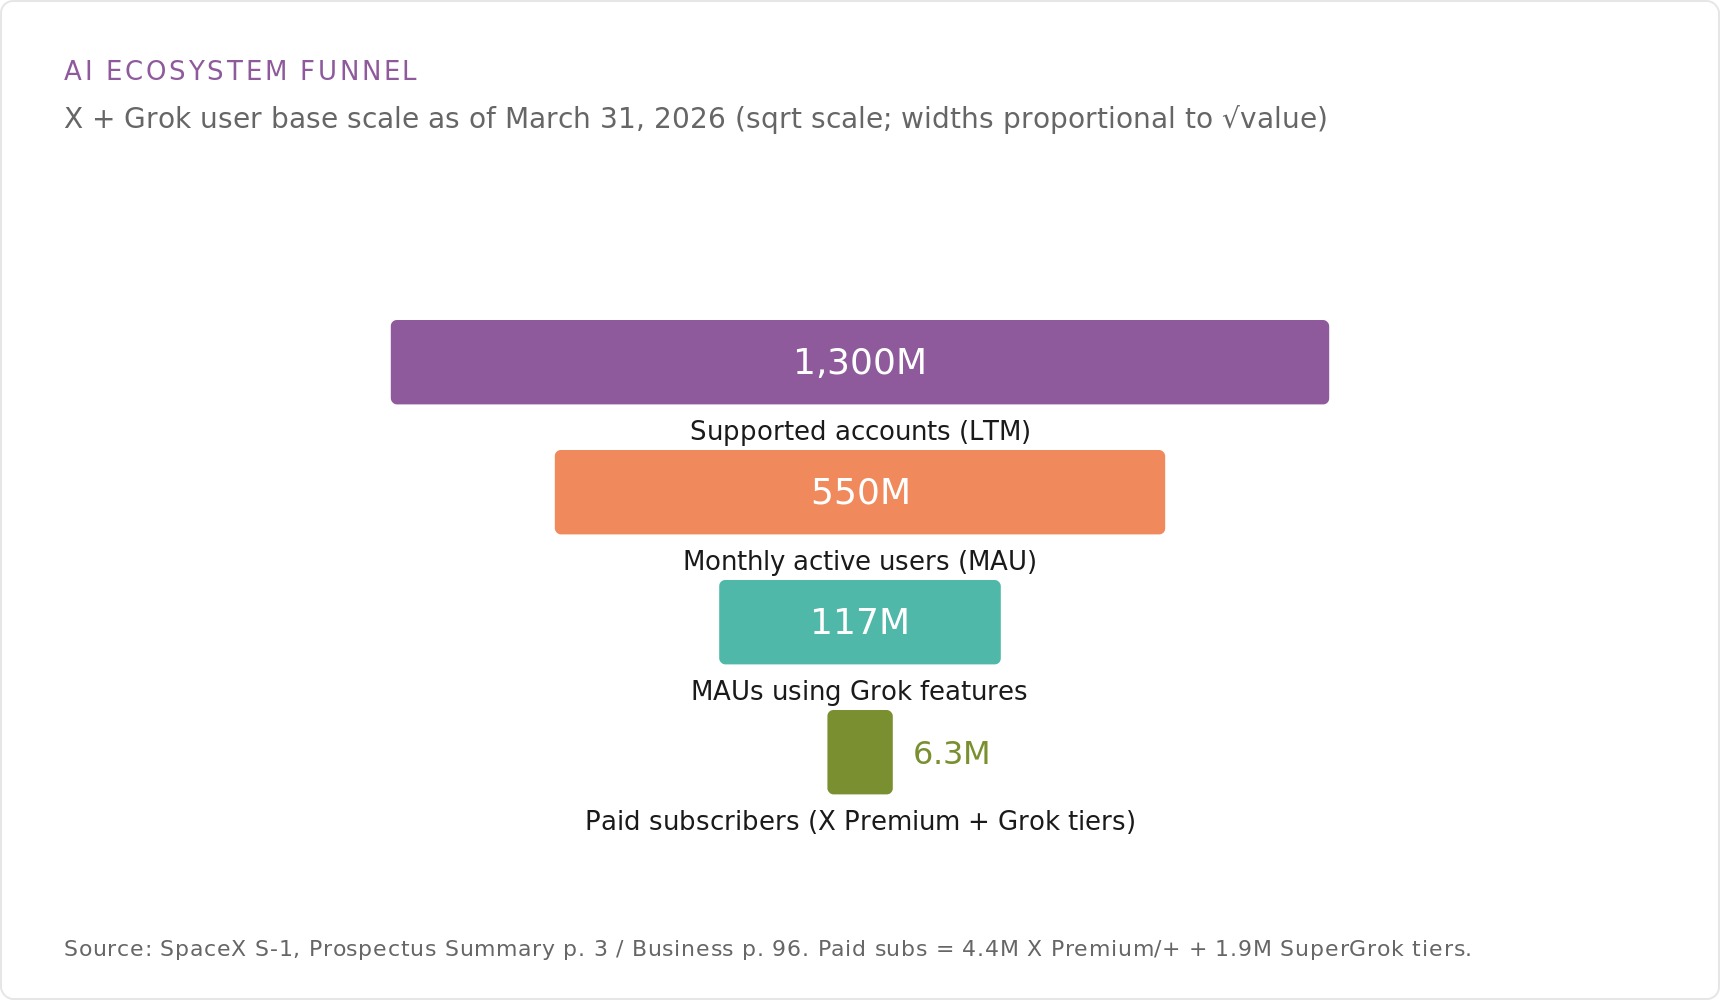
AI Ecosystem Funnel
This funnel scales the X and Grok user base as of March 31, 2026: 1.3 billion supported accounts over the trailing twelve months, 550 million monthly active users (MAU), 117 million MAUs using Grok features, and 6.3 million paid subscribers across X Premium and Grok tiers. Bar widths use a square-root scale, proportional to the square root of each value. Paid subscribers comprise 4.4 million X Premium and 1.9 million SuperGrok subscribers, per the filing.
Capital & Backlog
The last charts cover SpaceX’s capital expenditures, fixed-asset base, and contracted revenue.
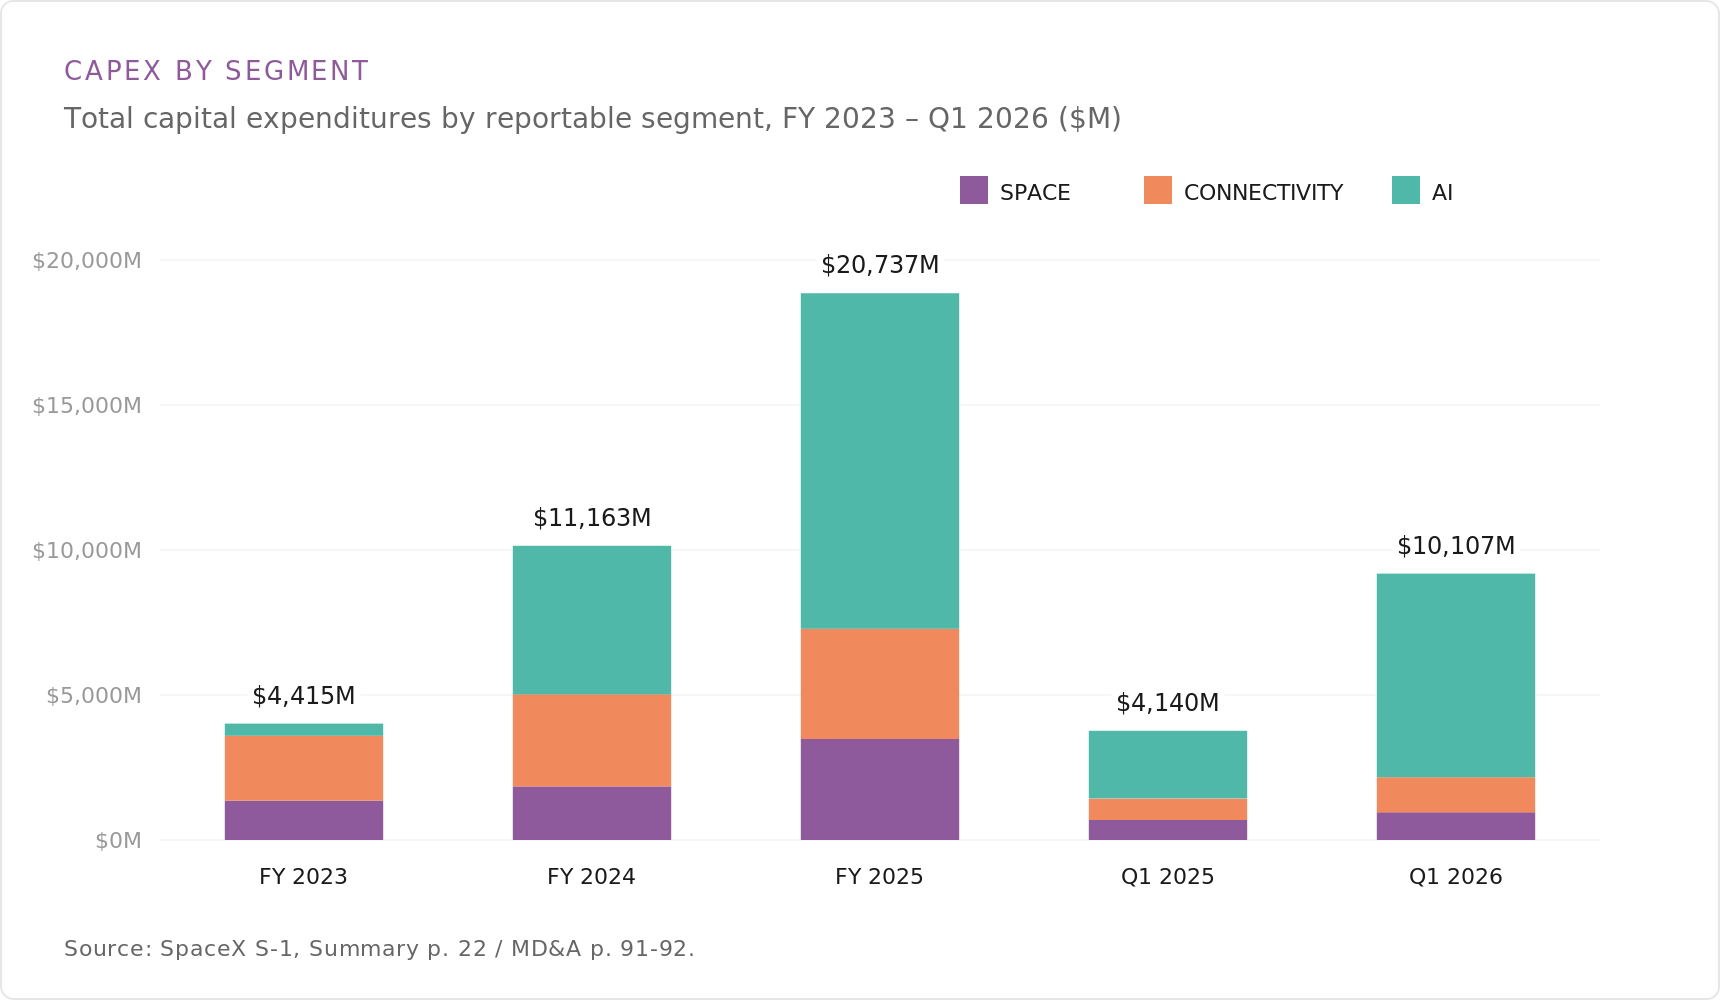
Capex by Segment
SpaceX’s capital expenditures totaled $20.7 billion in fiscal 2025, up from $11.2 billion in 2024 and $4.4 billion in 2023, split across the Space, Connectivity, and AI segments. First-quarter capex rose to $10.1 billion in Q1 2026 from $4.1 billion in Q1 2025, an elevated investment pace. Capex figures are from the S-1 summary and MD&A.
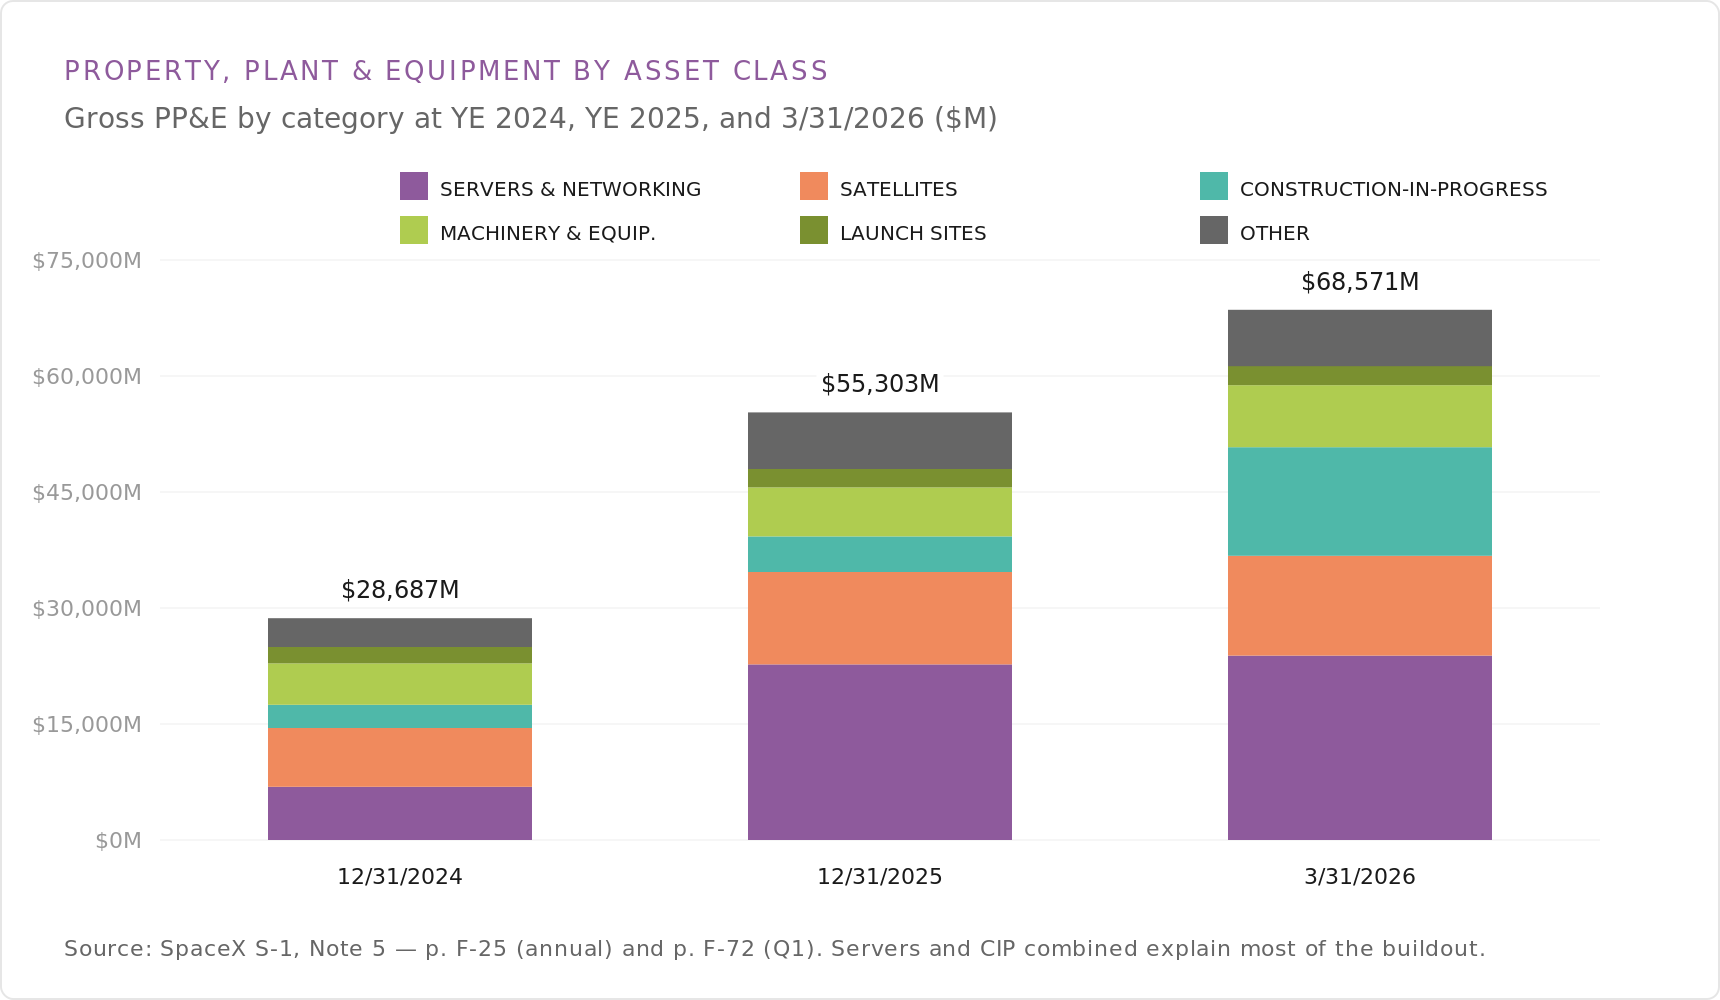
PP&E by Asset Class
Gross property, plant & equipment (PP&E) grew to $68.6 billion as of March 31, 2026, from $55.3 billion at year-end 2025 and $28.7 billion a year earlier. The breakdown spans servers & networking, satellites, construction-in-progress, machinery & equipment, launch sites, and other; servers and construction-in-progress together account for most of the buildout. Figures are from Note 5 of the financial statements.
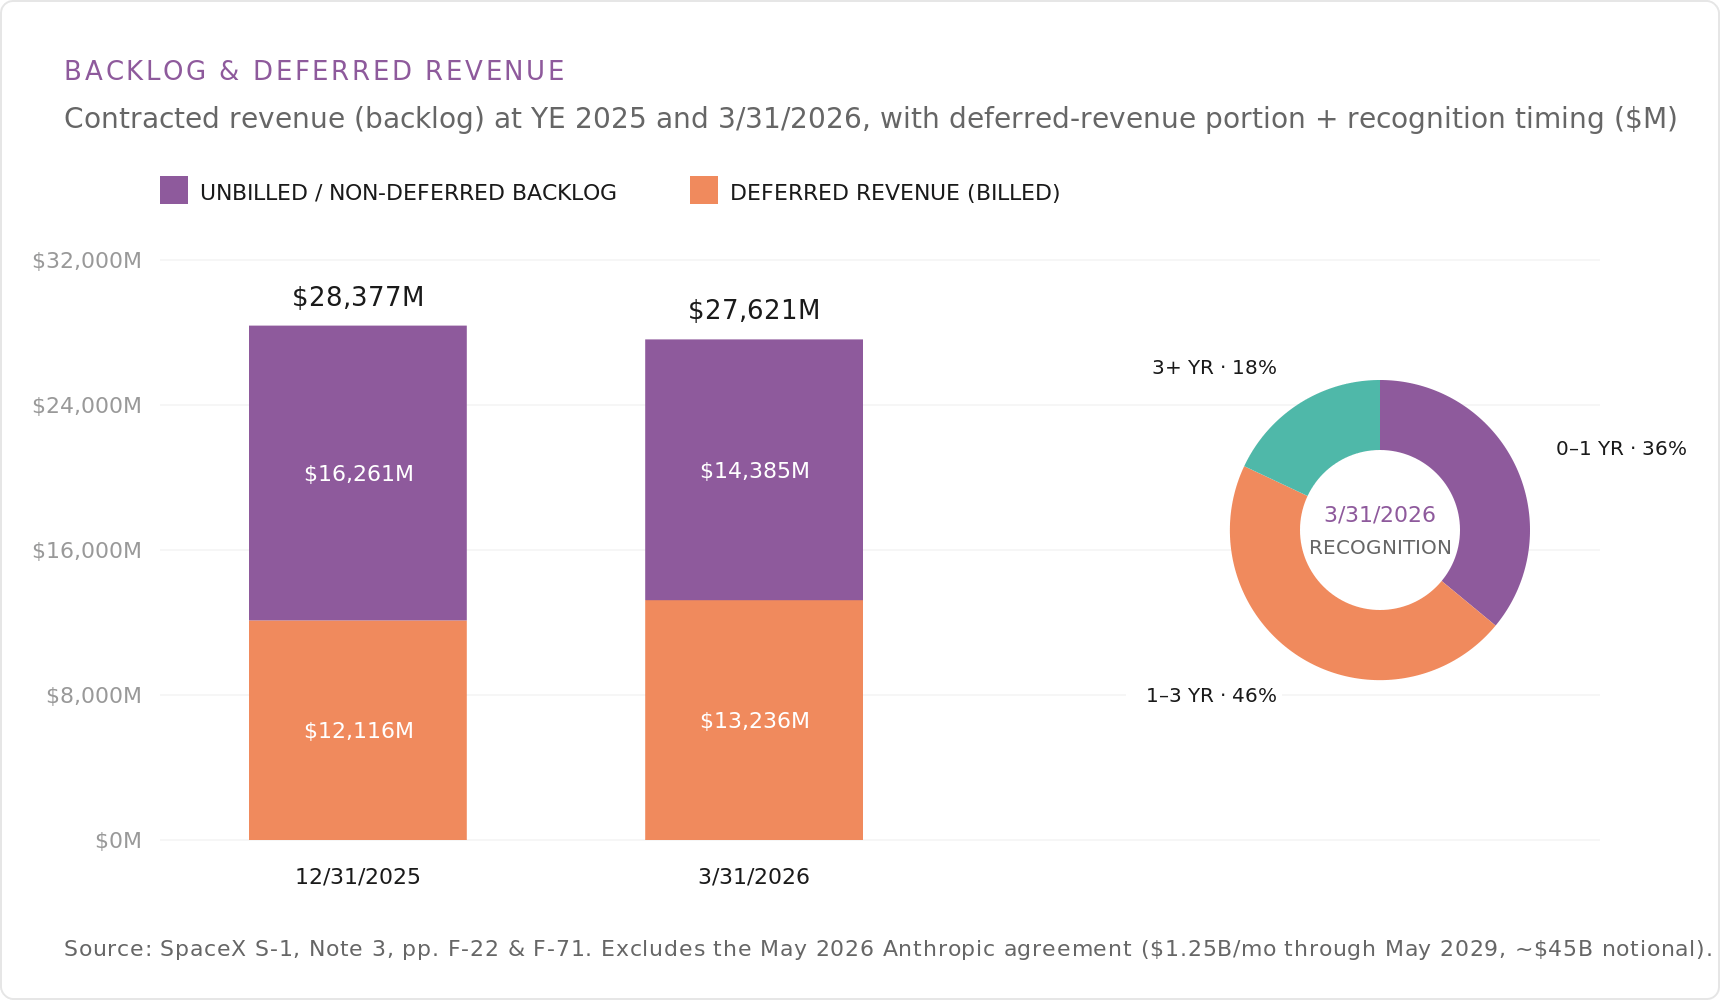
Backlog & Deferred Revenue
SpaceX reported contracted revenue (backlog) of $27.6 billion as of March 31, 2026, comprising $14.4 billion of unbilled/non-deferred backlog and $13.2 billion of billed deferred revenue, versus $28.4 billion at year-end 2025. By recognition timing, 36% is expected within one year, 46% in one to three years, and 18% beyond three years. The figures exclude a May 2026 agreement with Anthropic (about $1.25 billion per month through May 2029, roughly $45 billion notional), per the filing’s note.
Conclusion
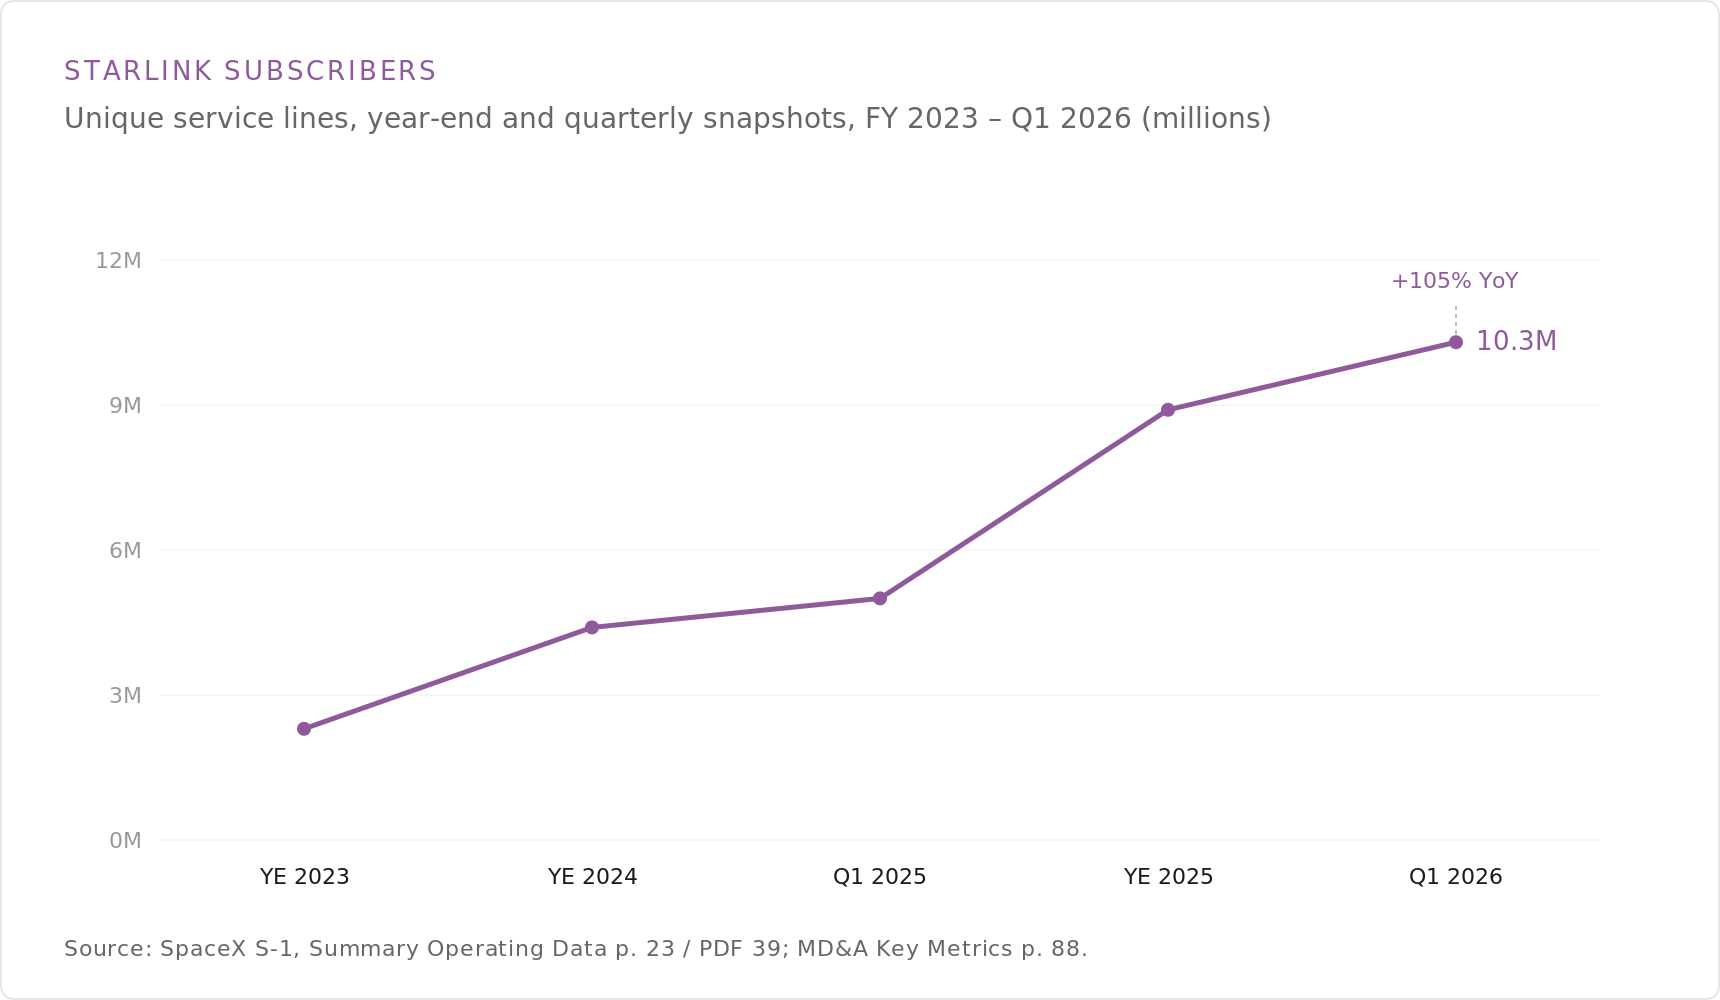
Taken together, the 18 charts describe one company running three businesses at very different stages. Connectivity — Starlink satellite internet — is the cash engine: $11.4 billion of revenue in fiscal 2025, a 63% Adjusted EBITDA margin, and 10.3 million subscribers. Space is the launch backbone, with 165 Falcon launches and more than 80% of global mass to orbit, though its segment margin has compressed to 16%. AI — X and xAI — is the heaviest investment, carrying $5.1 billion of R&D against $3.2 billion of revenue, with installed compute capacity reaching 1.0 gigawatt by the first quarter of 2026.
The consolidated numbers reflect that mix. SpaceX grew revenue from $10.4 billion in 2023 to $18.7 billion in 2025 and generated $6.6 billion of Adjusted EBITDA, while still reporting a $2.6 billion operating loss and spending $20.7 billion on capital expenditures. Gross property, plant & equipment stands at $68.6 billion and contracted backlog at $27.6 billion as of March 31, 2026.
Every figure in this pack is drawn directly from SpaceX’s S-1 registration statement filed with the SEC; the charts are free to use on any platform with credit.